to building digital ones —
Tools & Technologies
- Languages:RPythonJavaScript
- Front-end:ReactTailwind CSS
- Back-end:Node.jsExpress.js
- Databases:MongoDBGoogle Firebase
- APIs:CrossRefGender-APIOpenAlexSemantic Scholar
Research Contributions
- Presented at the 2024 Lassonde Undergraduate Research Conference and the 2024 Canadian Celebration of Women in Computing Conference
Citation Biases in Computing Literature
DARE! Lab at York University
May 2024 - Current
Over the summer of 2024 I conducted a large-scale analysis of more than 90,000 papers from the top 100 software engineering journals to investigate gender-based citation bias. My research uncovered a consistent pattern of under-citation of women and over-citation of men, with this disparity steadily increasing since 2009.
Building on the identification of biases in computing literature, I am leading the development of CiteFairly, an innovative online tool designed to help researchers analyze and address citation biases. CiteFairly is a web tool built with Node.js, Express.js, Google Firebase, and React, allowing researchers to input their reference lists and receive an analysis of gender biases. The tool generates a citation diversity statement and leverages the Semantic Scholar API to suggest related research that can help balance biases and diversify references. CiteFairly aims to tackle the citation biases identified in academic literature by providing actionable solutions that promote equitable referencing practices and encourage more balanced and inclusive citation habits.
Tools & Technologies
- Language: Python
- Machine Learning: Scikit-learn
- Data Visualization: Matplotlib
Research Contributions
- Presented at the 2023 Lassonde Undergraduate Research Conference
- Co-authored conference paper on improving smartphone positioning accuracy using machine learning techniques. Published findings at ION GNSS+ 2024
AI Applications in GNSS
GNSS Lab at York University
May 2023 – April 2024
I started this research project in the summer of 2023 with goal of investigating the feasibility of using machine learning techniques to enhance the accuracy of smartphone positioning data for driving navigation. Using a predetermined test track, I explored various algorithms and found that the k-nearest neighbors (KNN) algorithm achieved a 92% accuracy rate in classifying the quality of positioning data.
Following the initial success of the project, I collaborated with my research team to explore more advanced machine learning techniques, such as Random Forest models, to classify GNSS signals into line-of-sight (LOS) and non-line-of-sight (NLOS) categories. By leveraging GNSS signal features such as carrier-to-noise density ratio (C/No), elevation angle, residuals, innovations, and pseudorange consistency along side ML we aimed to scale the measurement covariance matrix to enhance precise point positioning (PPP) accuracy. Our findings demonstrated that machine-learning-assisted PPP methods could significantly improve positioning accuracy, with root mean square (RMS) error reductions of up to 69% at the 95th percentile across various datasets.
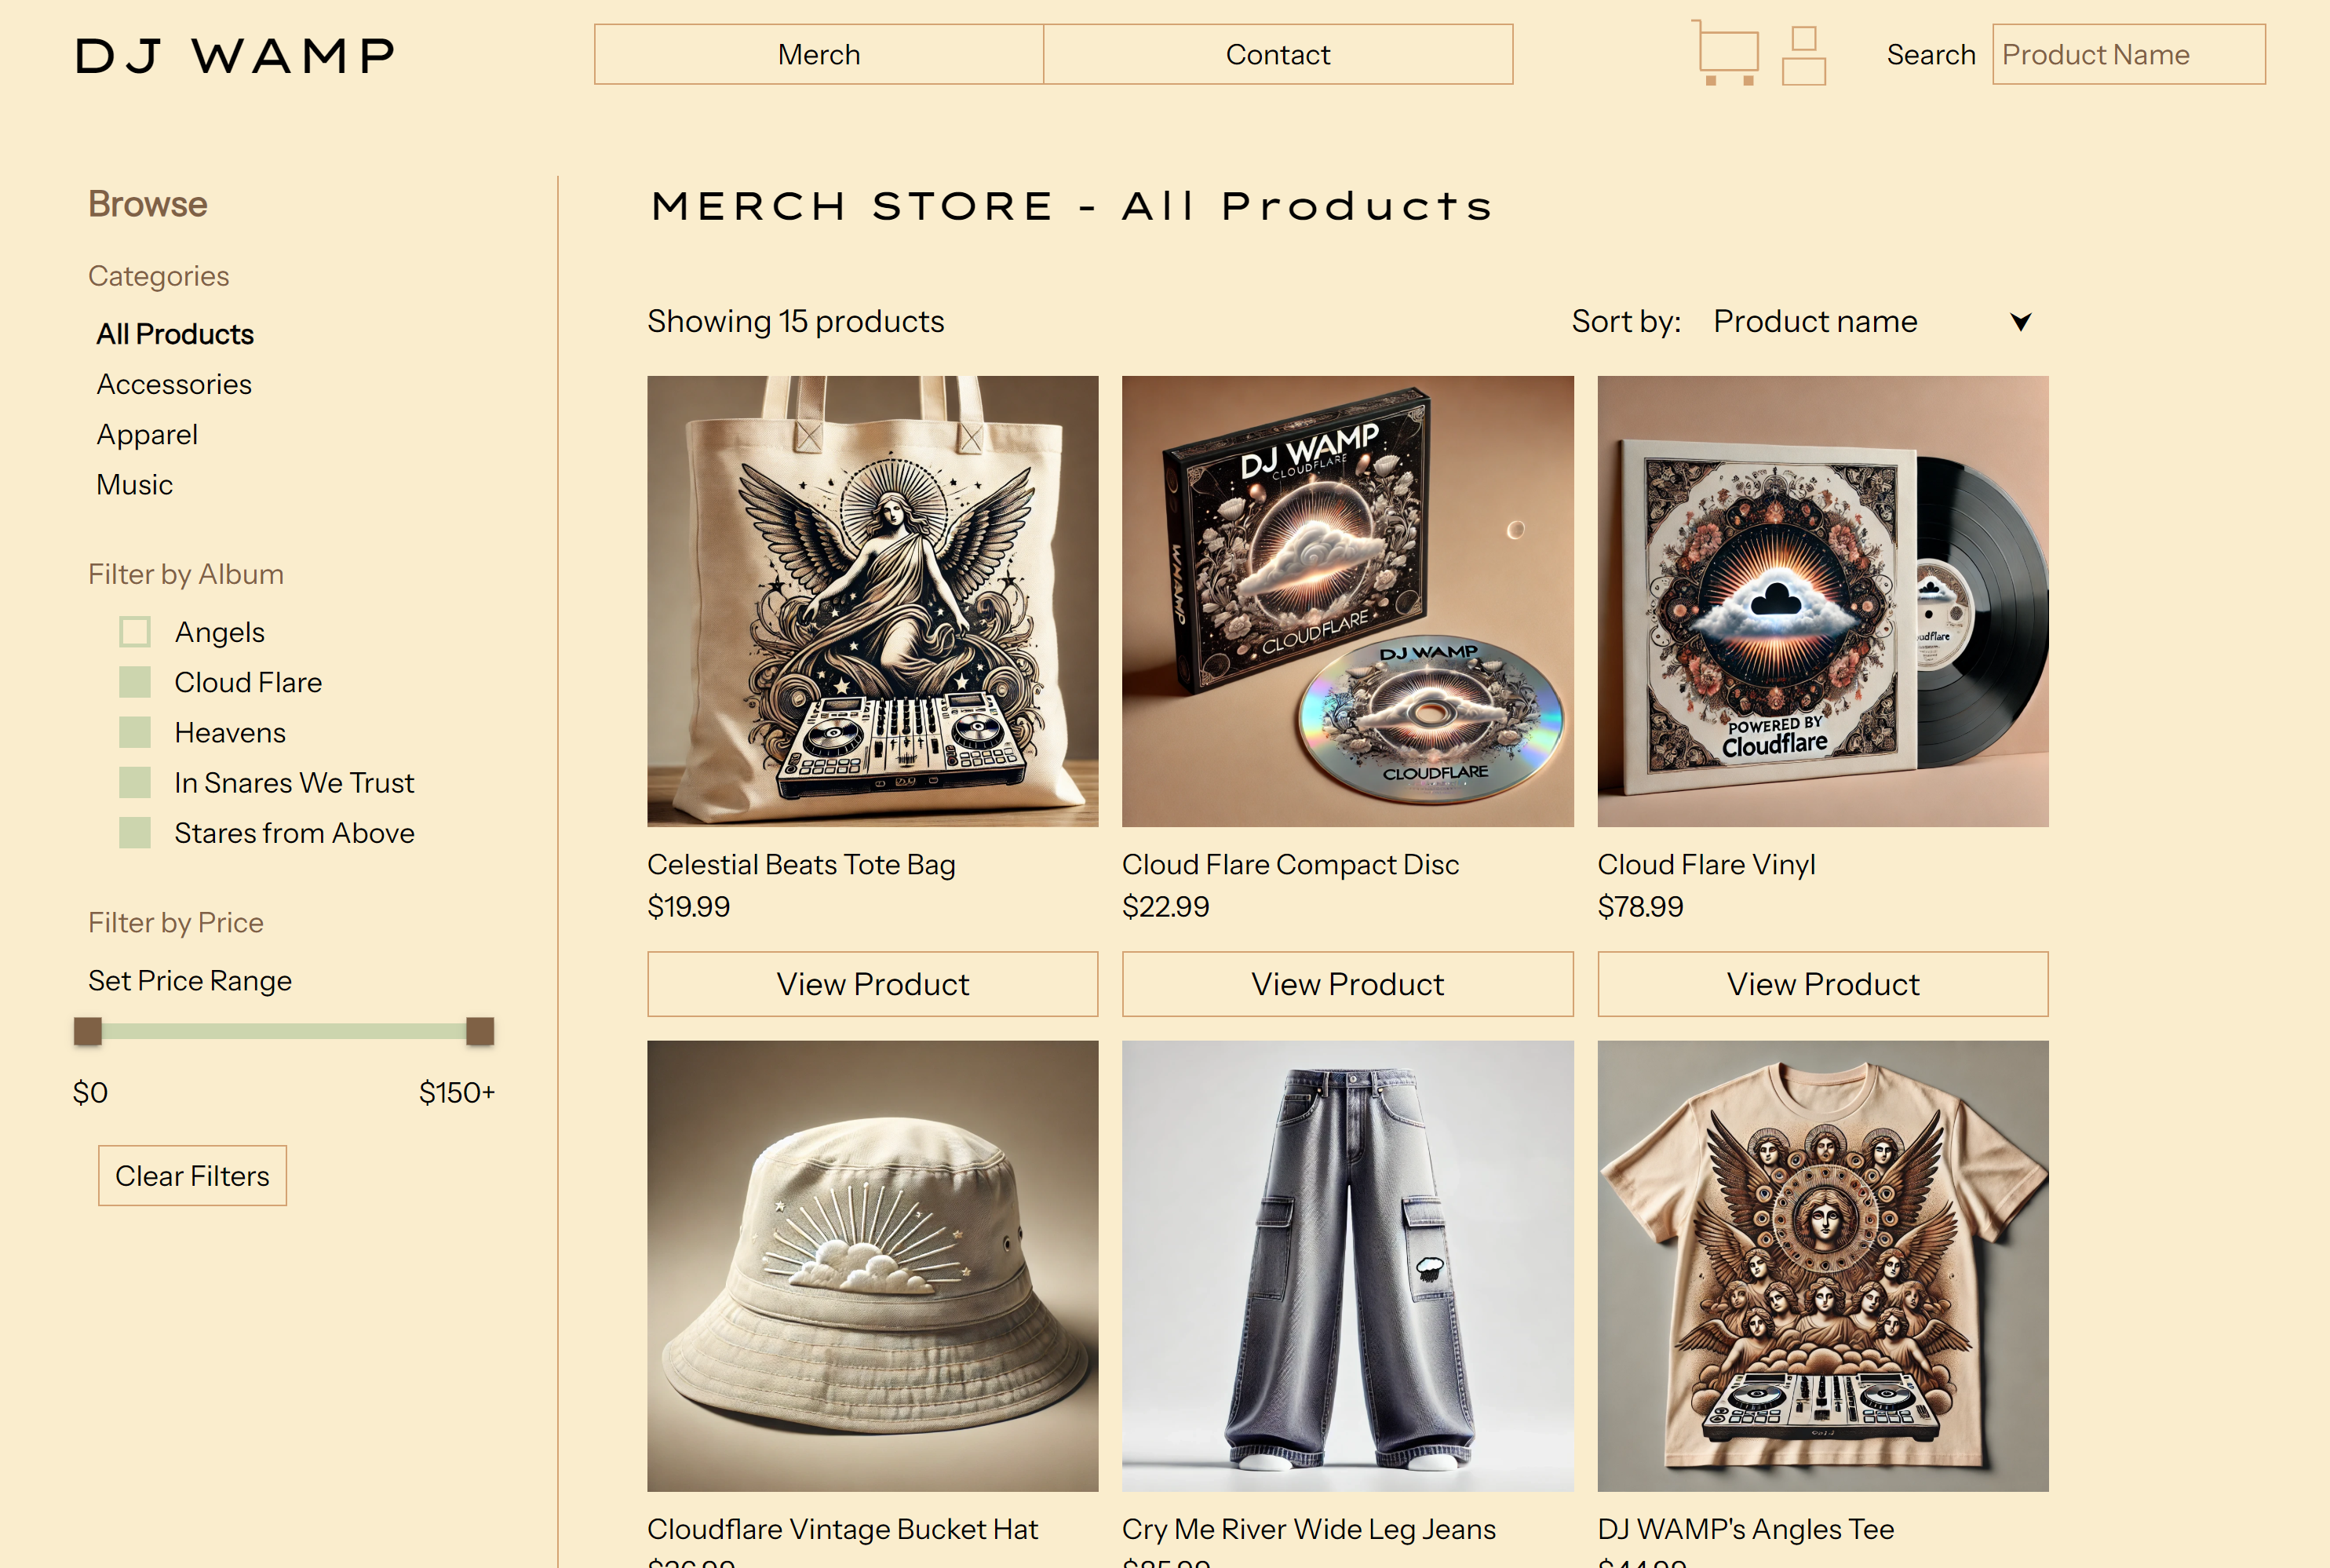
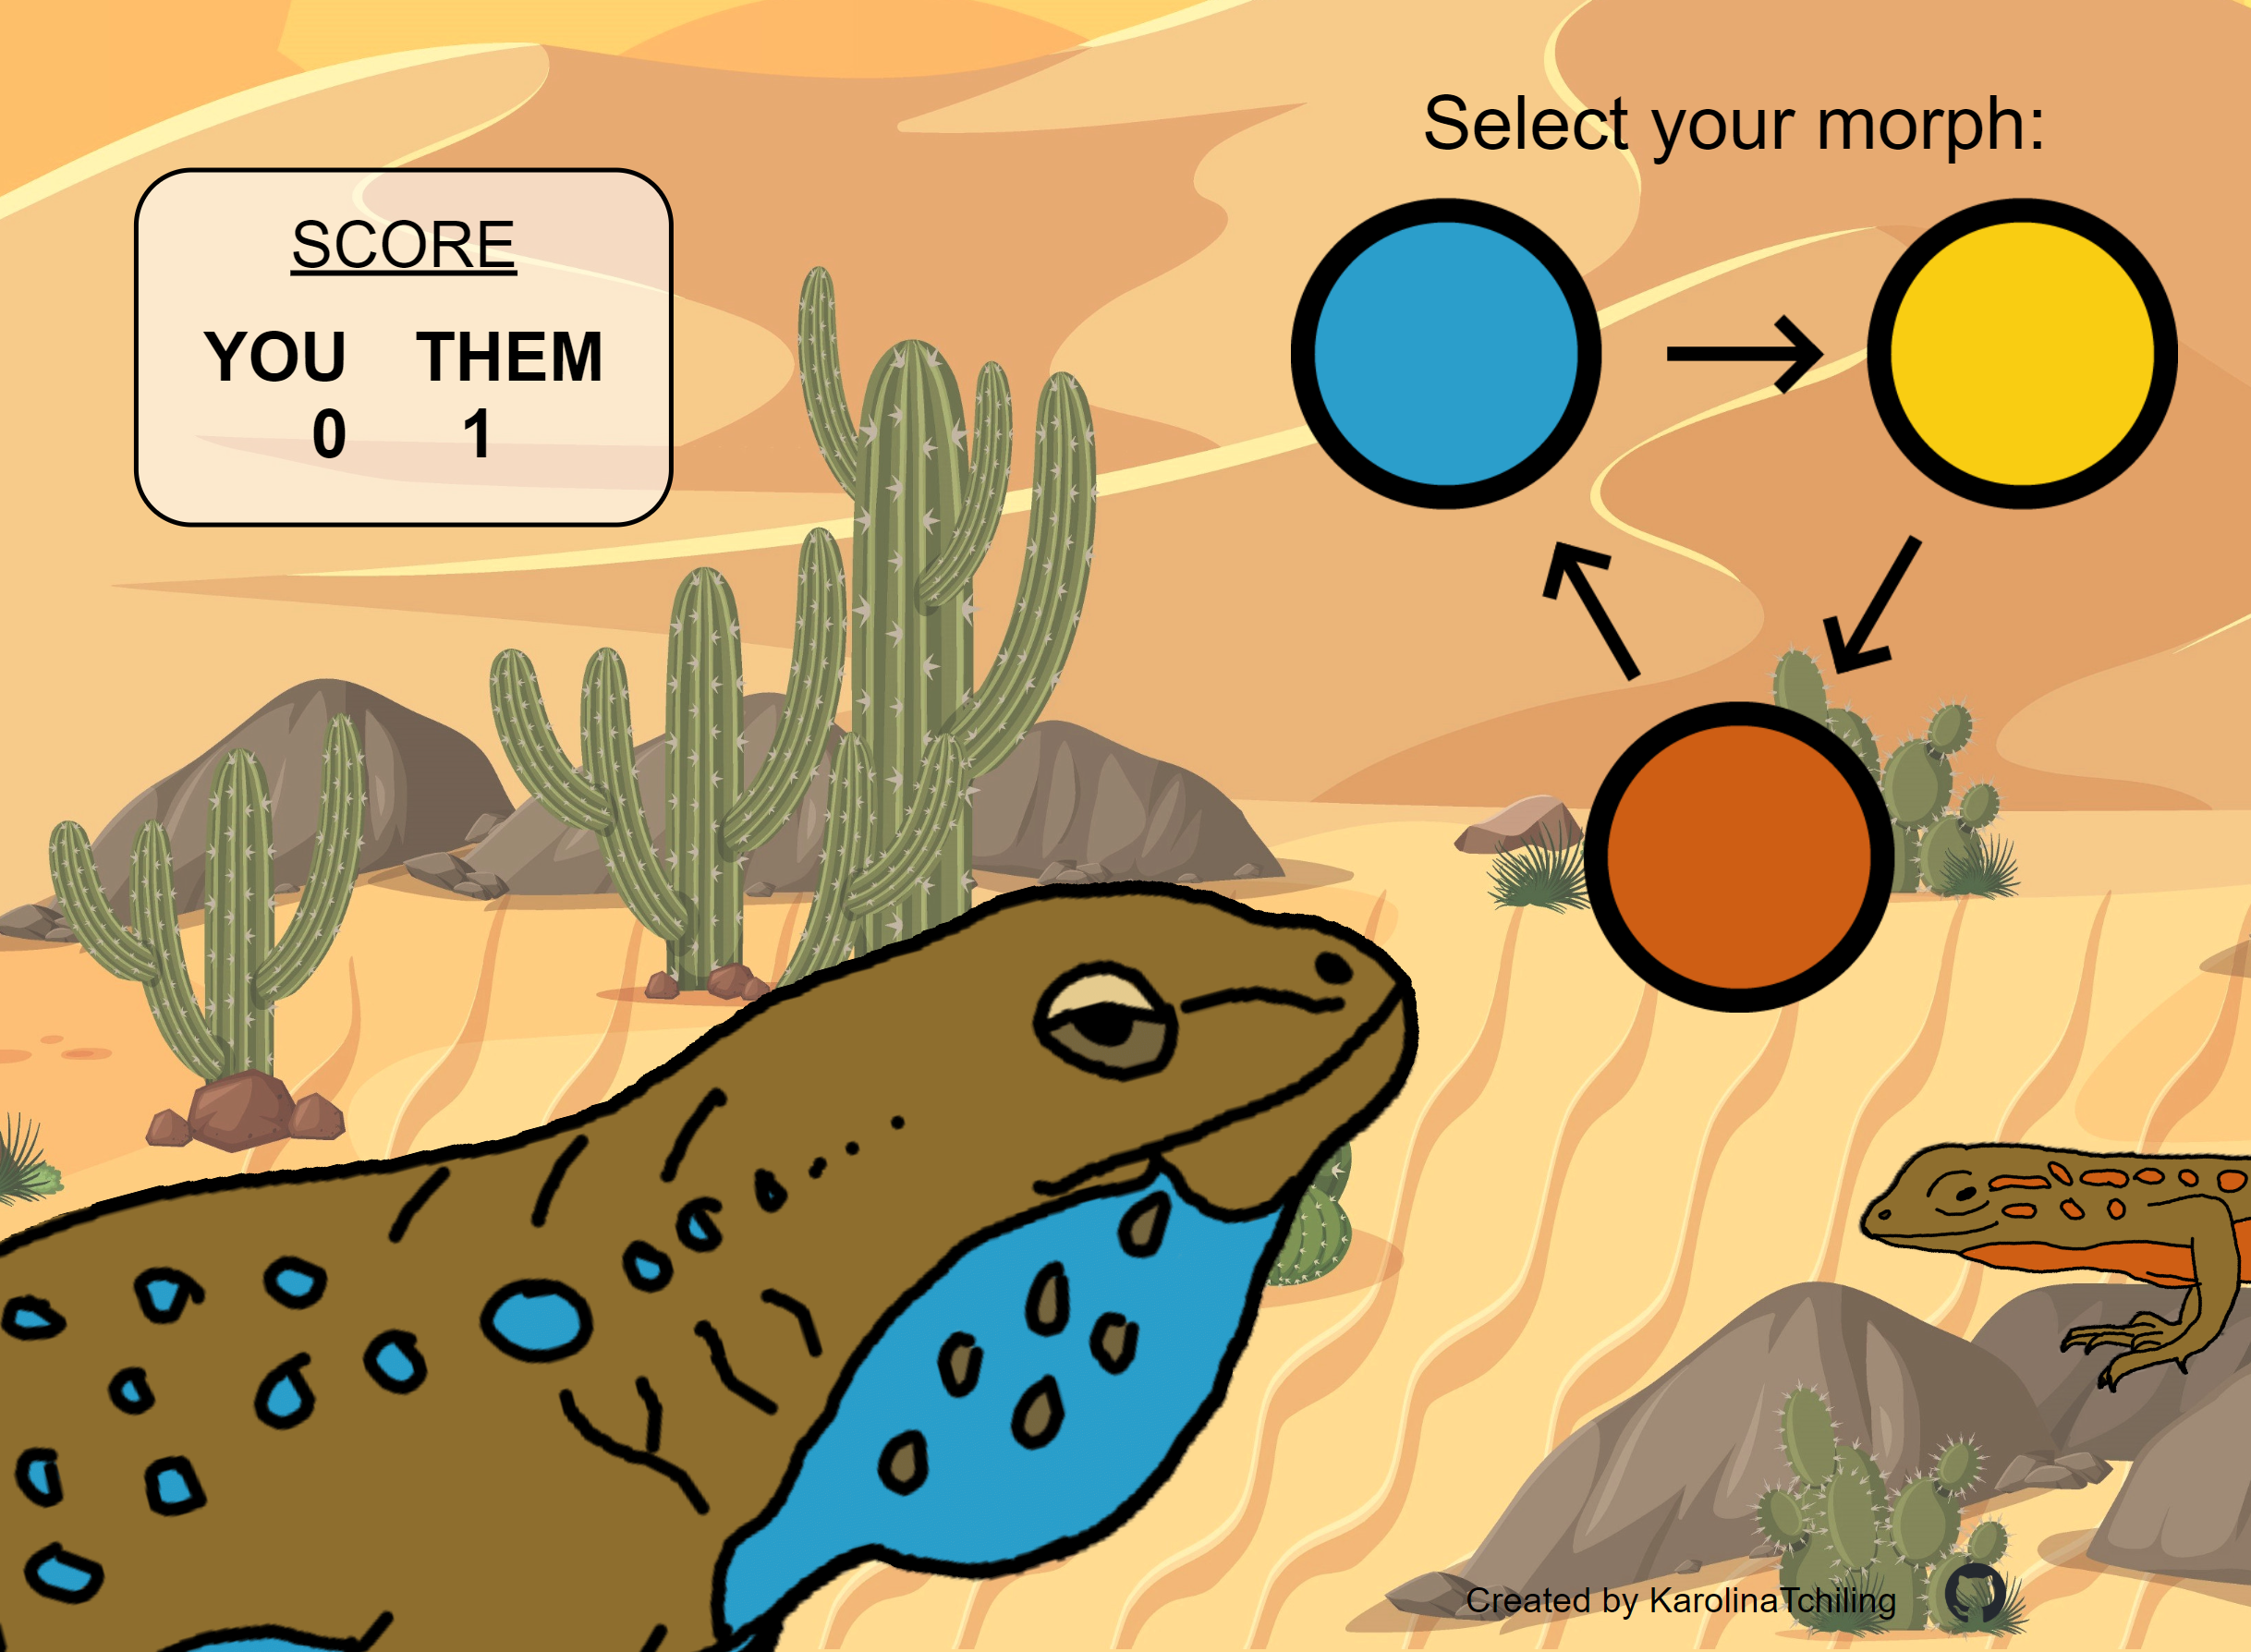
My Portfolio - Your looking at it!
A personal portfolio created to highlight my diverse projects, where I delved into interactive web design and 3D web modeling. Through this portfolio, I aimed to explore innovative design techniques and experiment with various tools and frameworks to enhance user engagement and visual storytelling.
Tech Stack
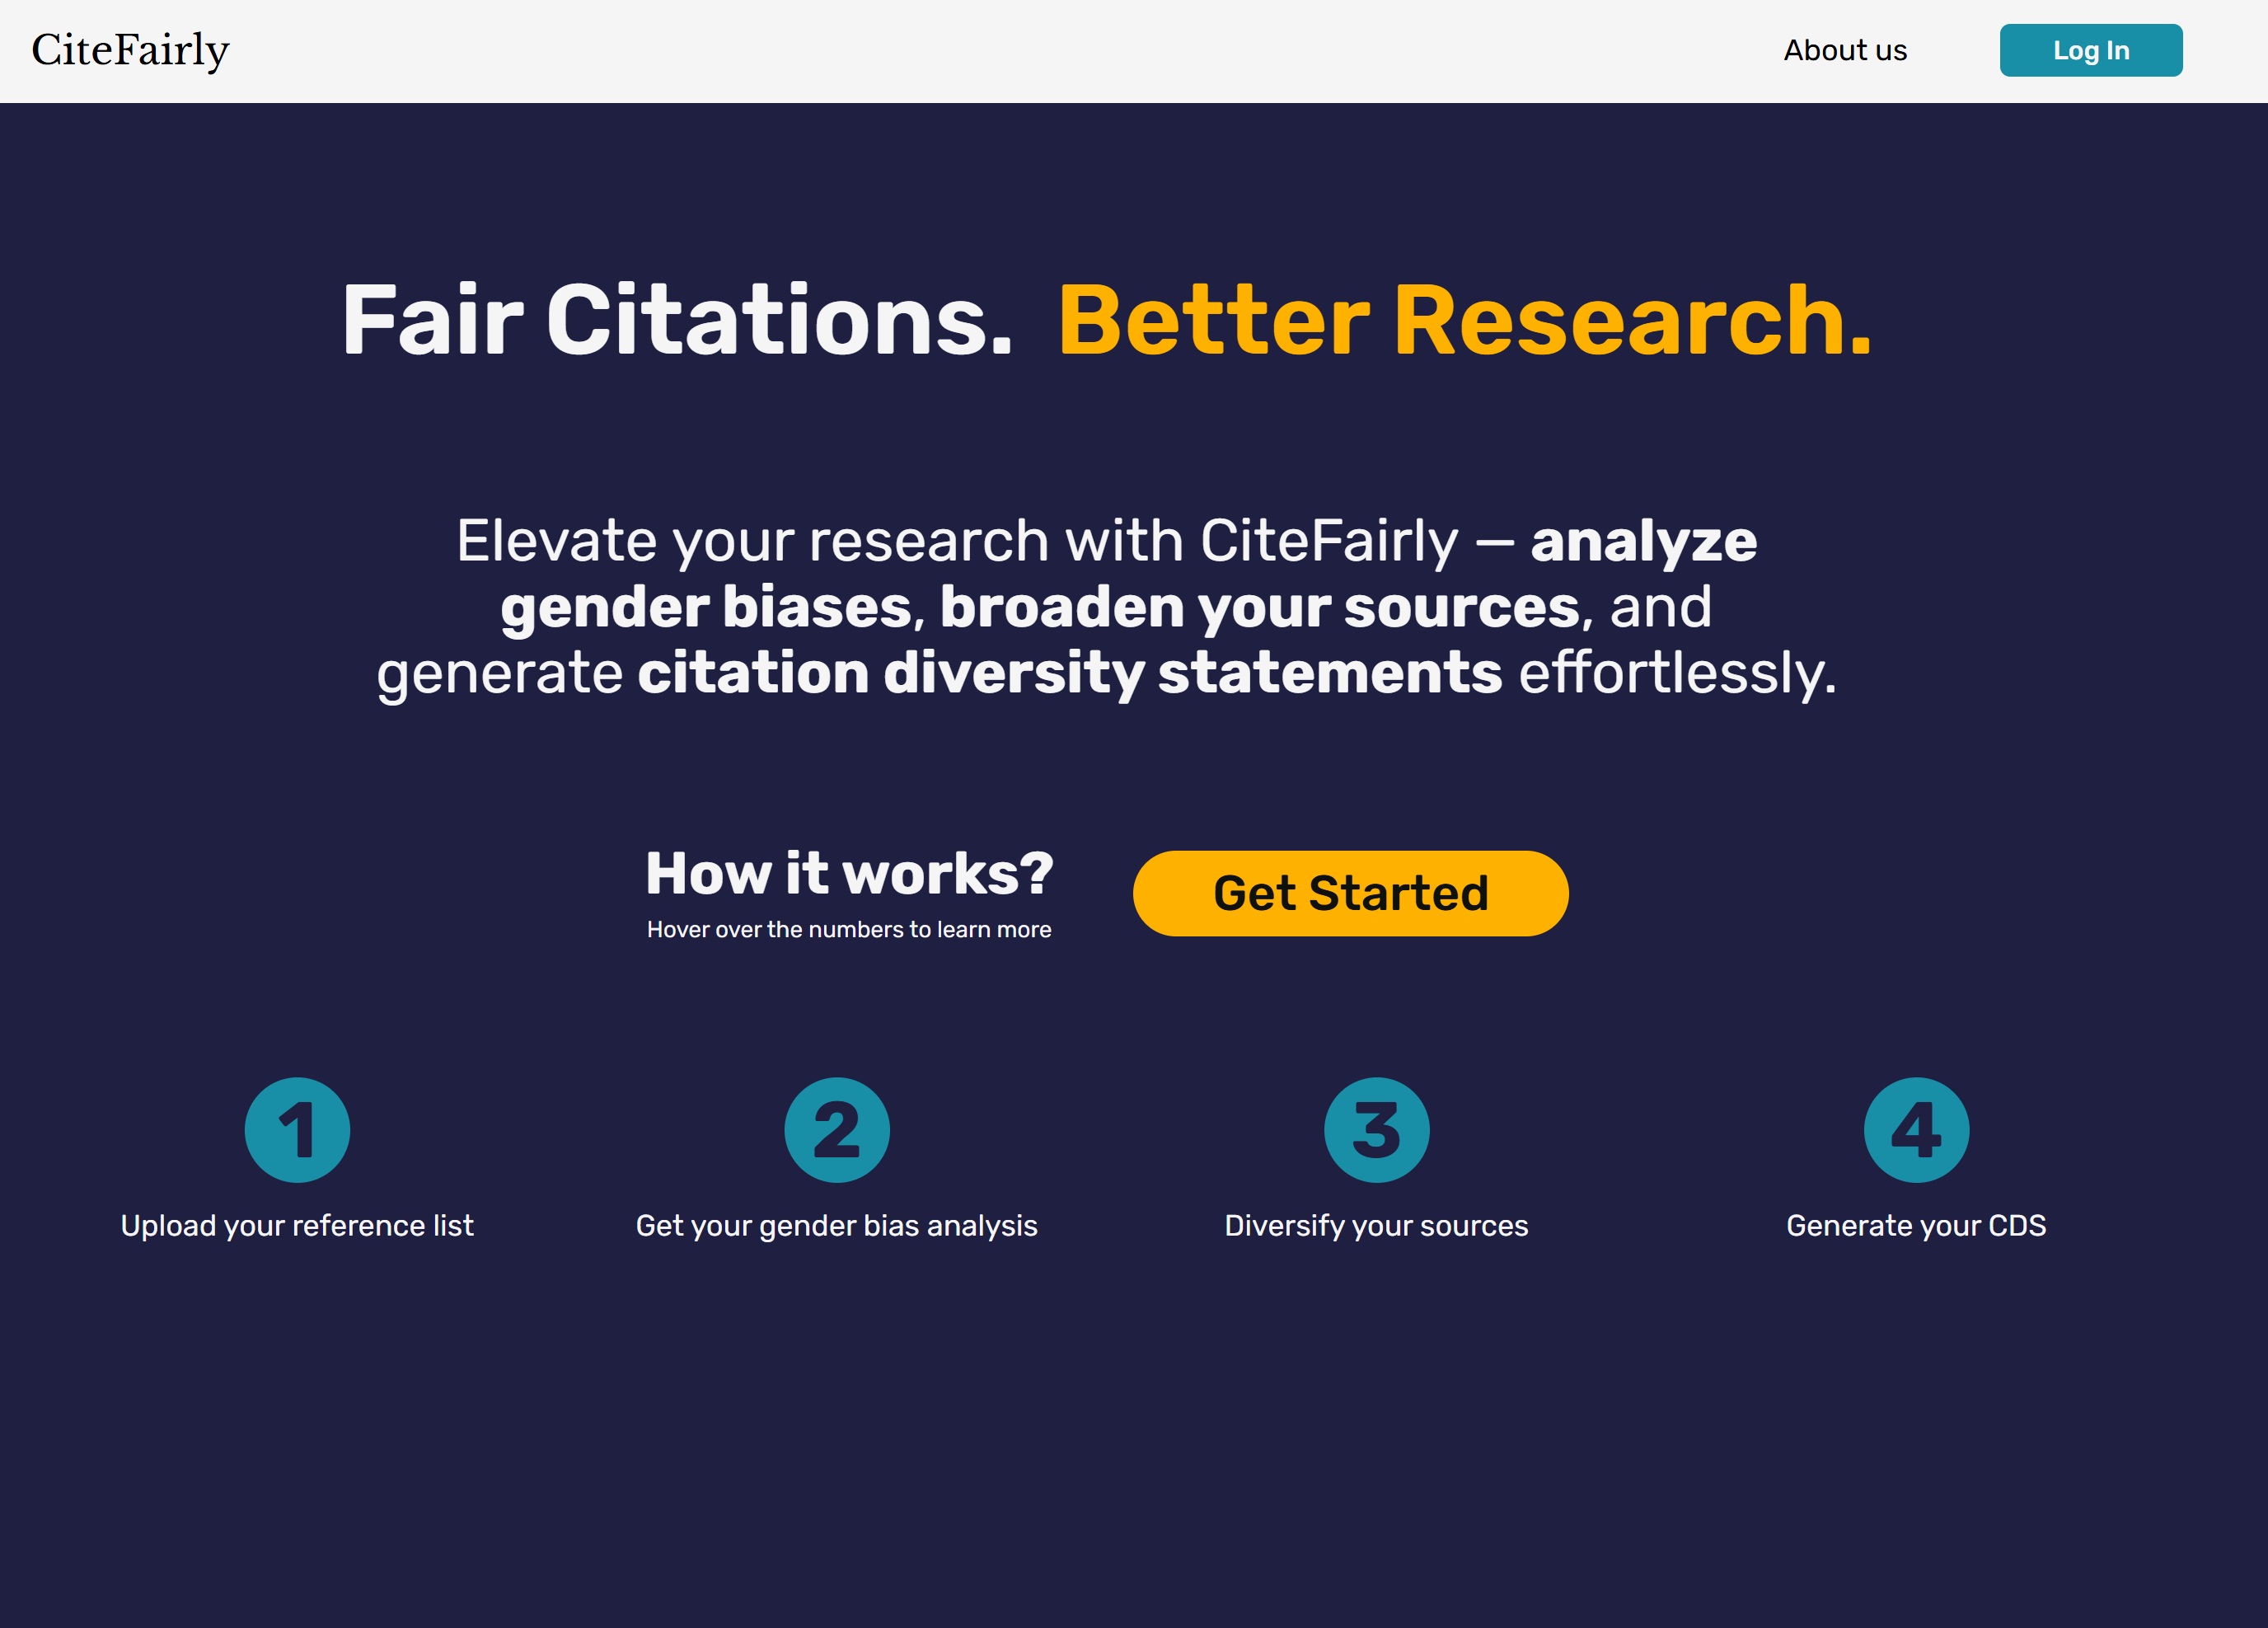
CiteFairly
CiteFairly is a web tool that analyzes reference lists for gender bias, generates citation diversity statements, and recommends related research via the Semantic Scholar API to promote more equitable and inclusive citation practices.
Tech Stack

Habitat Suitability Analysis of the Aishihik Wood Bison Herd in Yukon, Canada
A weighted suitability analysis was conducted to identify the favorable and unfavorable areas throughout the Aishihik wood bison herd's range. The weighted model considered two major influences; environmental/physical and human activities.
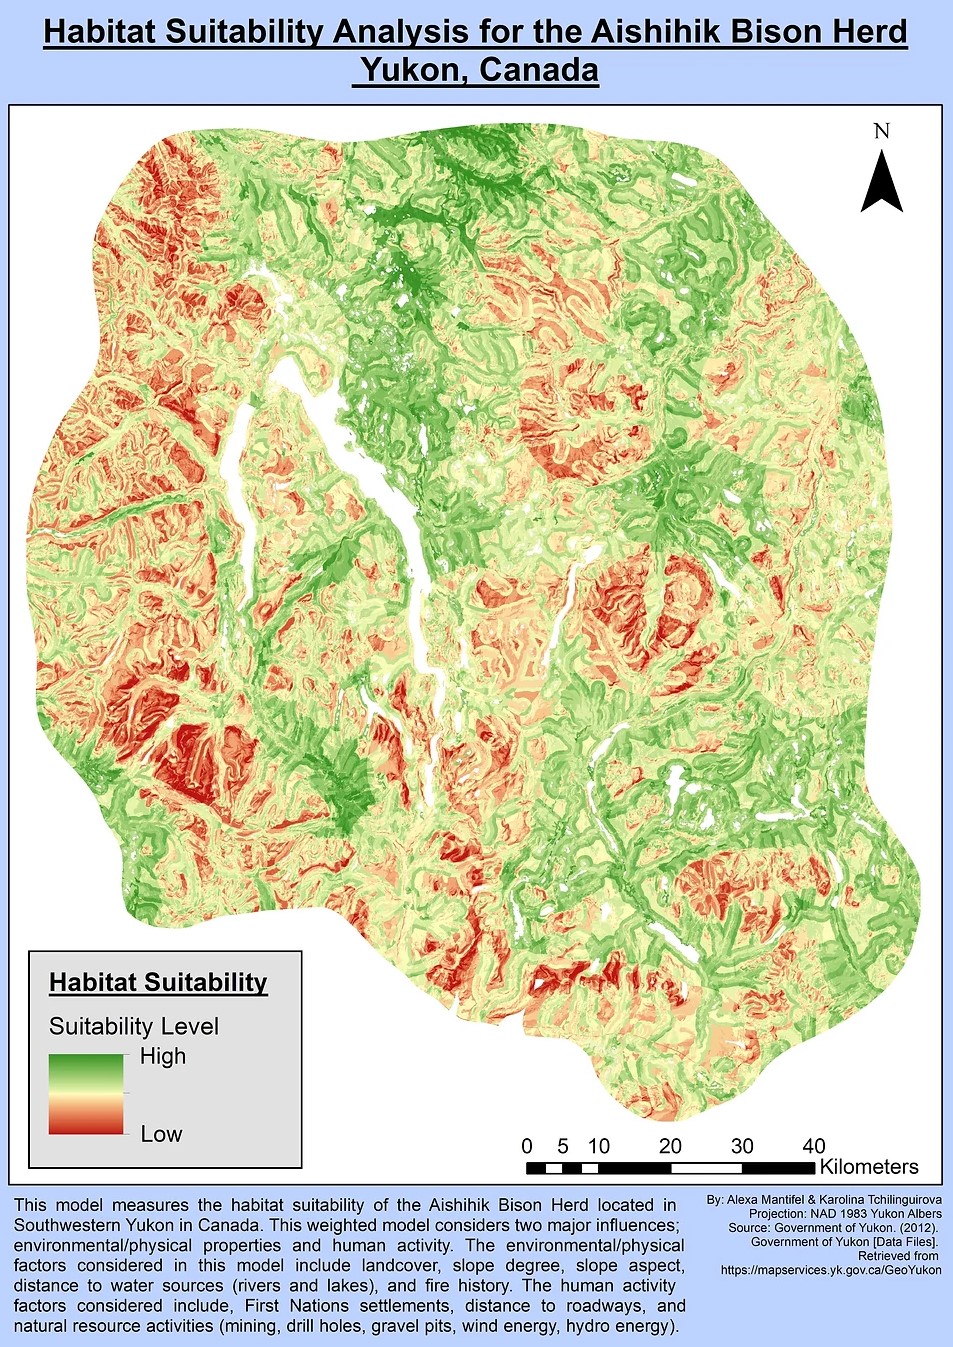
The environmental data consisted of a landcover and fire history shapefile as well as a DEM used for slope and aspect calculations. These 5 factors were classified into suitability on a scale of 1 - 5 and used to create the habitat suitability map as shown on the top left image.
The human data consisted of road vector files, settlement polygons, and a natural resource activity point file which included mining, drill holes, gravel pits, wind energy, and hydro energy sites. Each variable was buffered and classified to create the habitat suitability map as shown on the image in the top right.
A weighted suitability analysis combined both influences to identify the favorable and unfavorable areas throughout the herd range. As shown in the map to the left; red areas represent low habitat suitability, whereas green areas represent areas of high habitat suitability.
Regression Analysis of Logging Activities on Caribou Populations in Omineca Region, BC
An Ordinary Least Squares regression analysis was conducted on the relationship between logging activities and caribou populations. The OLS model indicated a negative relationship between logging activities and caribou herd population.
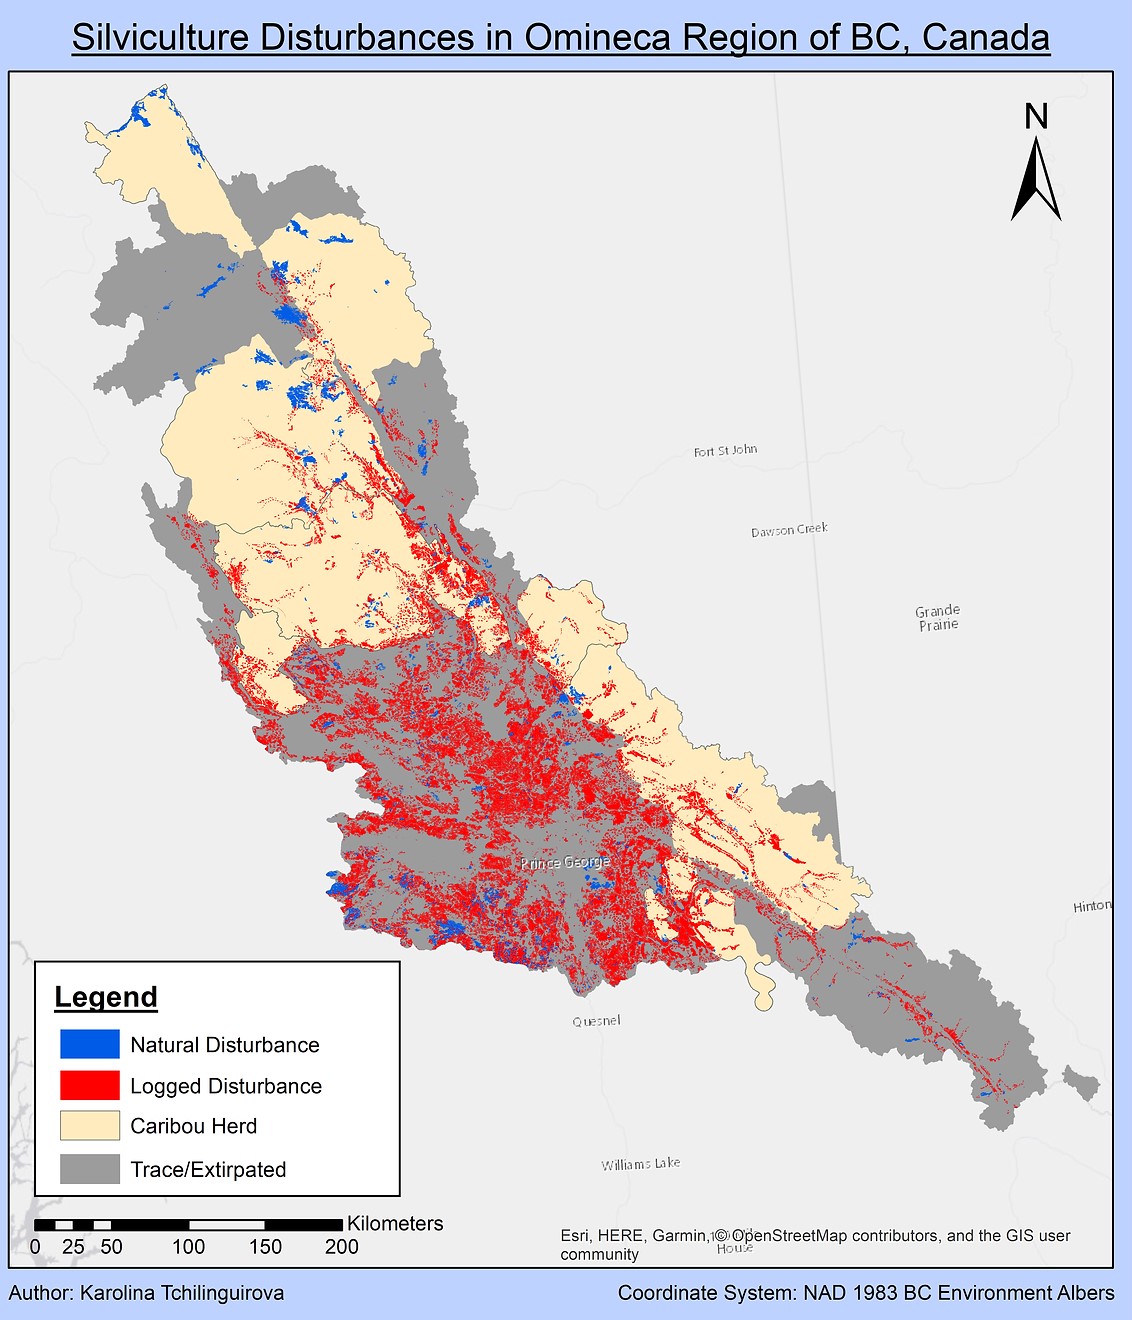
Silviculture disturbances are shown superimposed on the location of the caribou herds.
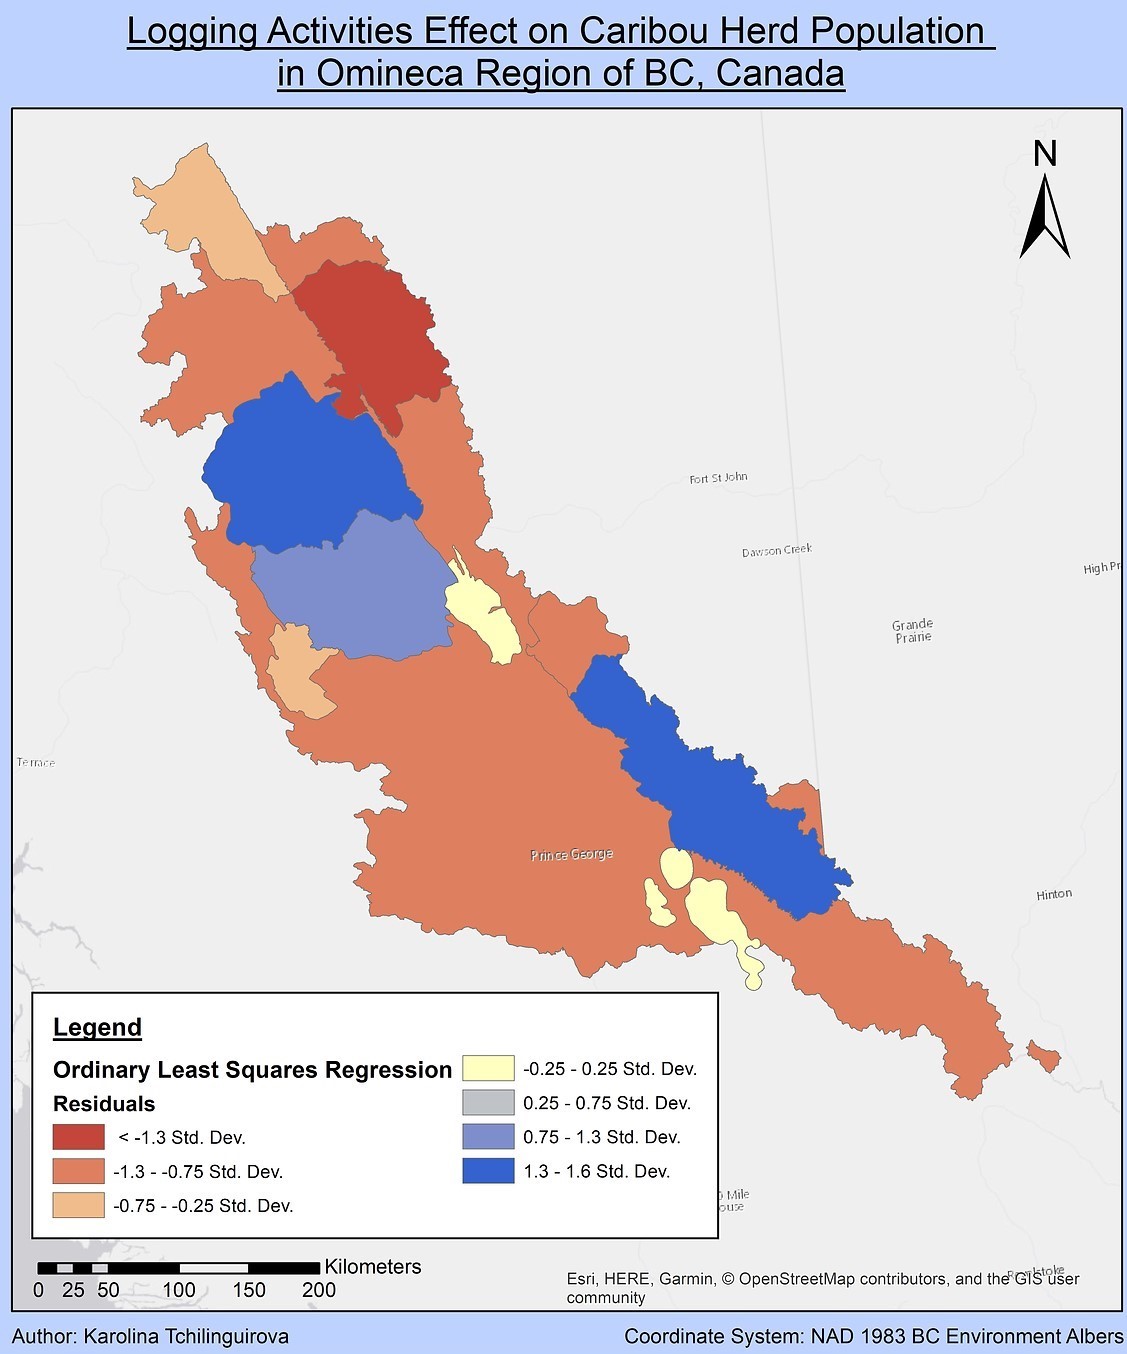
The red polygons represent herds which are predicted to have their population decrease at a rate faster than the regression estimates.
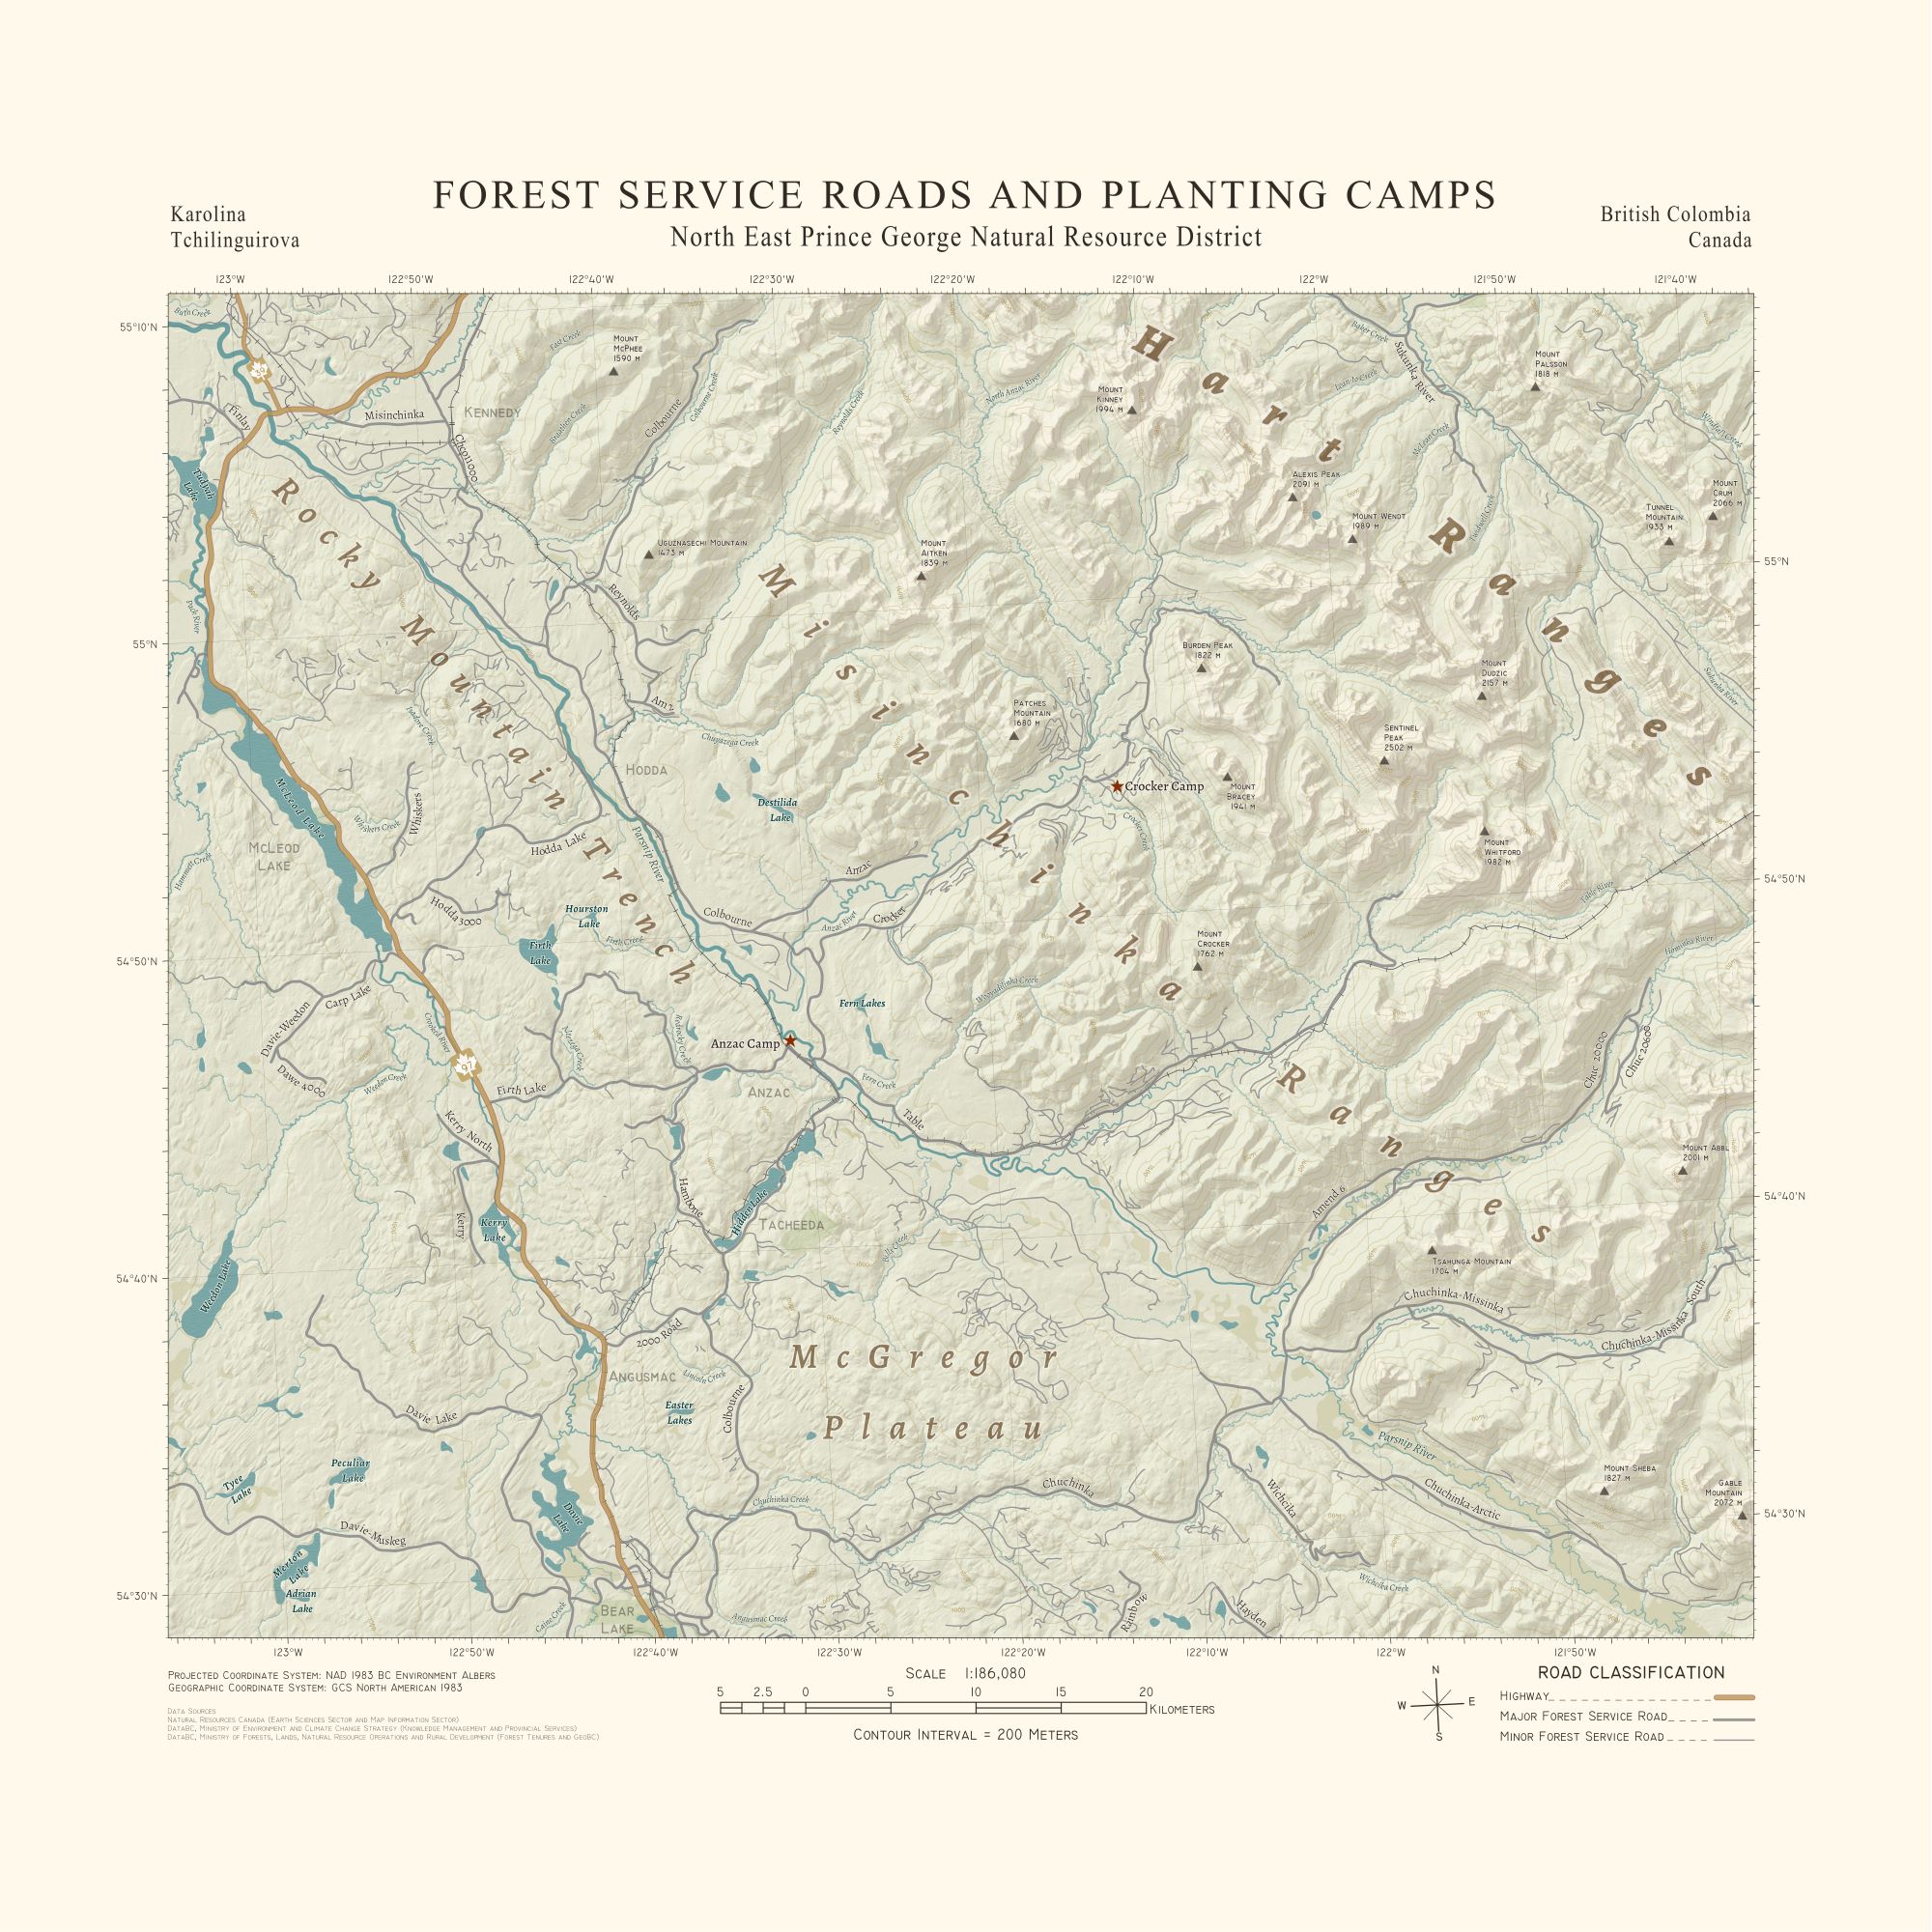
More Than Just a Map: A Tribute to My Time in the North
This map is a personal project where I explored the artistic side of GIS, inspired by my summer's tree planting in Northern BC. I've spent countless hours driving up and down Highway 97 to and from Prince George on my days off and navigating the region's busy logging roads in the company F-550 trucks, calling out, "Pick-up 50 down on the Crocker." I've marked the two planting camps where I lived out of a tent—enduring hot, cold, and rainy nights in Bear Country. I've planted over 100,000 trees in this area, contributing to my tree planting career total of over half a million. This map holds deep sentimental value for me, so much so that I have a 3-by-3-foot framed copy displayed in my living room, a constant reminder of my connection to this land.